Personal Informatics and Visualization of my book reading habit
Overview
When I was in my second grade, my parents gifted me “Five on a Treasure Island”, a book that is part of the Famous Five series by Enid Blyton. I was so engrossed in reading the book that I would not even get up from my table for hours and hours together. With this started my journey of reading books. I went on to read more fiction, non-fiction, mythology and horror genres throughout my school life. I also cultivated a habit unconciously: whenever I bought a hardcopy book, I would write down the date in which I bought the book, when I started reading the book and when I completed reading the book. Unknowingly, I had tracked my book reading habits, but I never went back to the book to understand my reading speed and other reading stats that I could have looked into.
This habit of mine started deteriorating over the years and now I am not able to even get myself to start reading a book of my choice although I have so many books in my reading list. With this personal informatics project, I intended to bring back my childhood memories by re-cultivating that habit but this time also understanding my pace of reading, the distractions that interrupt my reading cycle, and many more stats.
Role: UX Researcher, Interaction Designer, Data Analyst
Methods: Habit tracking, Competitive Analysis, Pilot Tests, Usability Study, Data Analysis and Visualization, Information Visualization, Data scoping
Individual Project
Duration: 8 weeks
The Goal
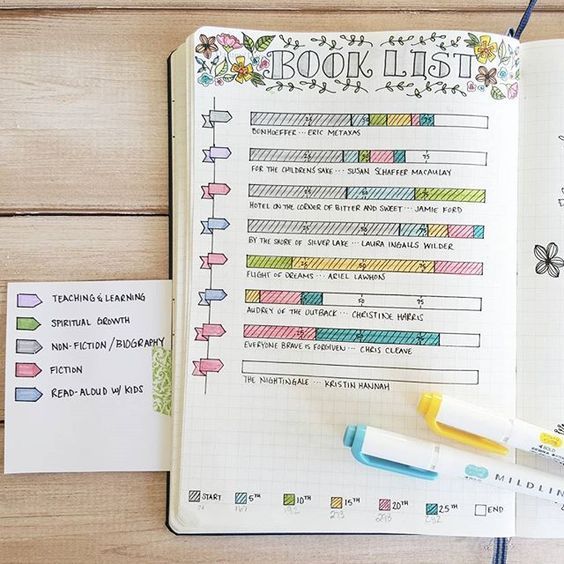
My over-arching goal through this self-tracking project is to track my book reading habits - by setting myself a goal on how many books I plan to read during the tracking period(one month), to understand my periods of distraction, and the time I take to completely finish reading a book. Tracking my book reading habits will increase awareness towards how much time I spend on a book, my periods of distraction while reading a book which will, in turn, help me understand and strategize on how to minimize distractions and enrich my reading experience. I would also become mindful and be nudged at times to record my data which would make me more aware of my surroundings even during hectic schedules.
Process
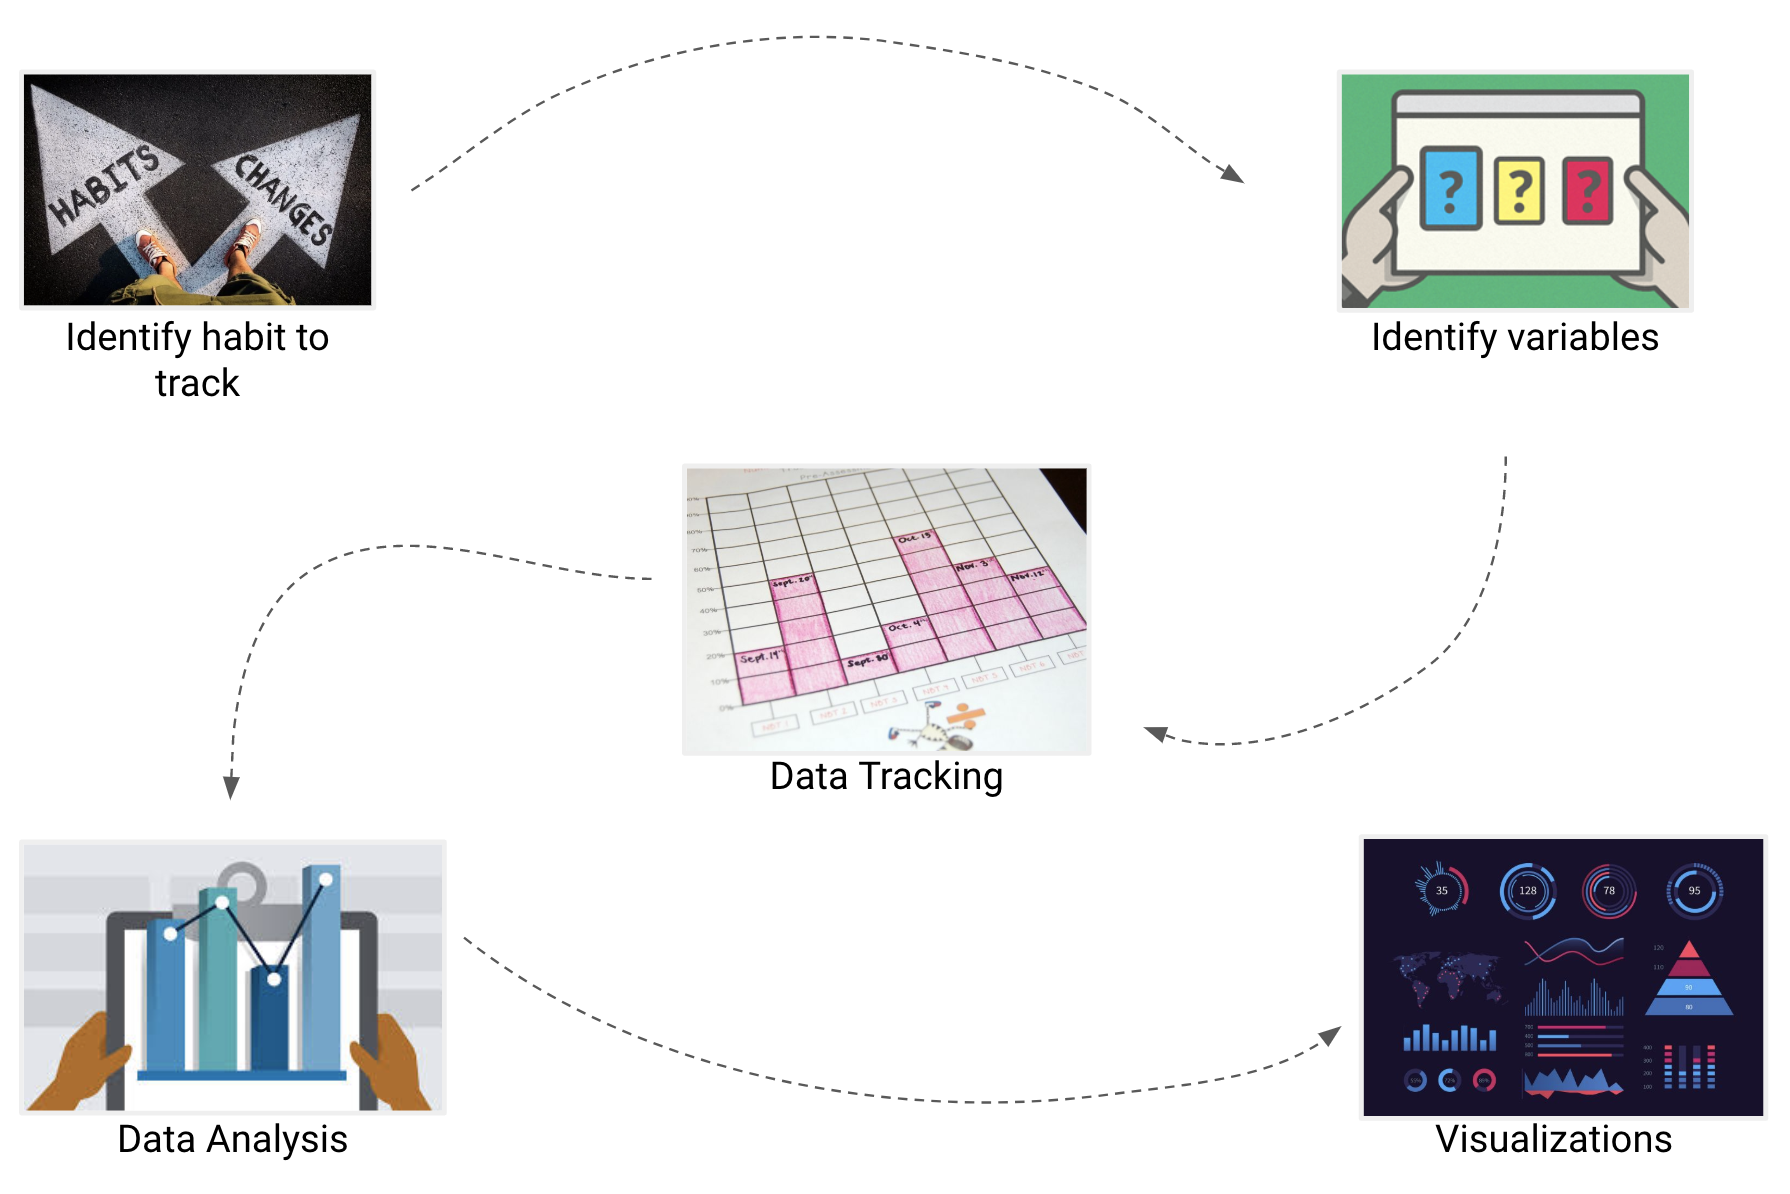
The process began with identifying a habit to track, then identified the variables that revolve around making the habit meaningful, after which began the data tracking phase. I tracked my personal book reading habit data for over a month (from October 1st to November 9th, 2018) and read 5 books in this period. Post my data tracking phase, I researched on various data and information visualization techniques that would make my data meaningful. Rigorous analysis was performed on the data with which I finally presented 3 visualizations that emerged from my reading data.
Target Behavior and Contextual Information
Going by the inspiration that I received from researching on existing book trackers(Goodreads, Bookly, and Bookling), I tracked the time taken for me to complete a book from start to finish, my reading time per day, periods of distraction include the total amount of distraction time as well as what I was distracted on(eg., responding to a WhatsApp message, talking to my roommate). Further, I started to list 5 - 10 themes that emerge from the book I was reading(for eg., “mystery”, “thriller”, “murder”, “conspiracy” for a crime novel) so that when I look back at a later point in time, I would be able to easily recollect what the book was about and I would not be wasting time in writing up a detailed review of the book.
Since I had also not been an avid reader in the recent past, I had also set myself a goal of reading at least 5(just a decent number so I do not get overburdened amidst coursework load) medium-sized novels in this tracking period. Furthermore, I also wanted to find out what days suits me the best - i.e, on which day of the week my reading productivity was the highest and made me more focused and minimizes my distraction. With this information, I would able to find out my most productive time and not only adhere to that time just for reading novels but also probably extend it to when I want to do more focused work(probably while studying).
Data Tracking Methods
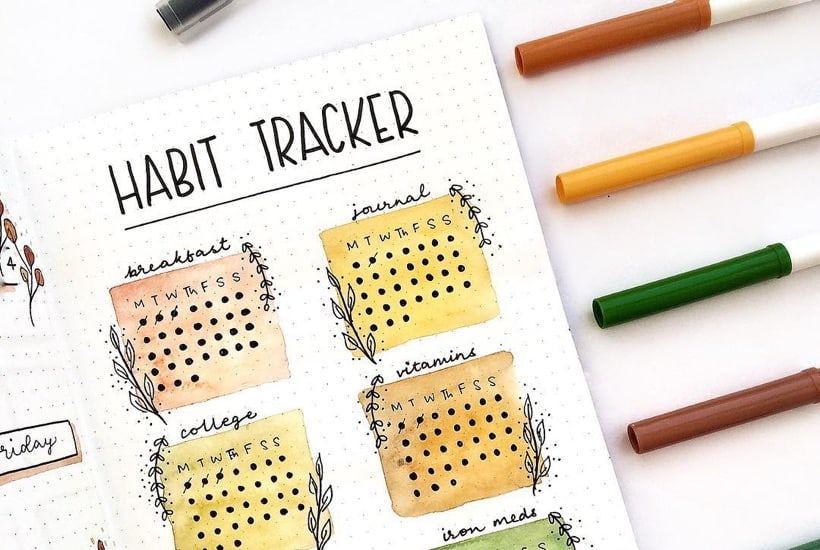
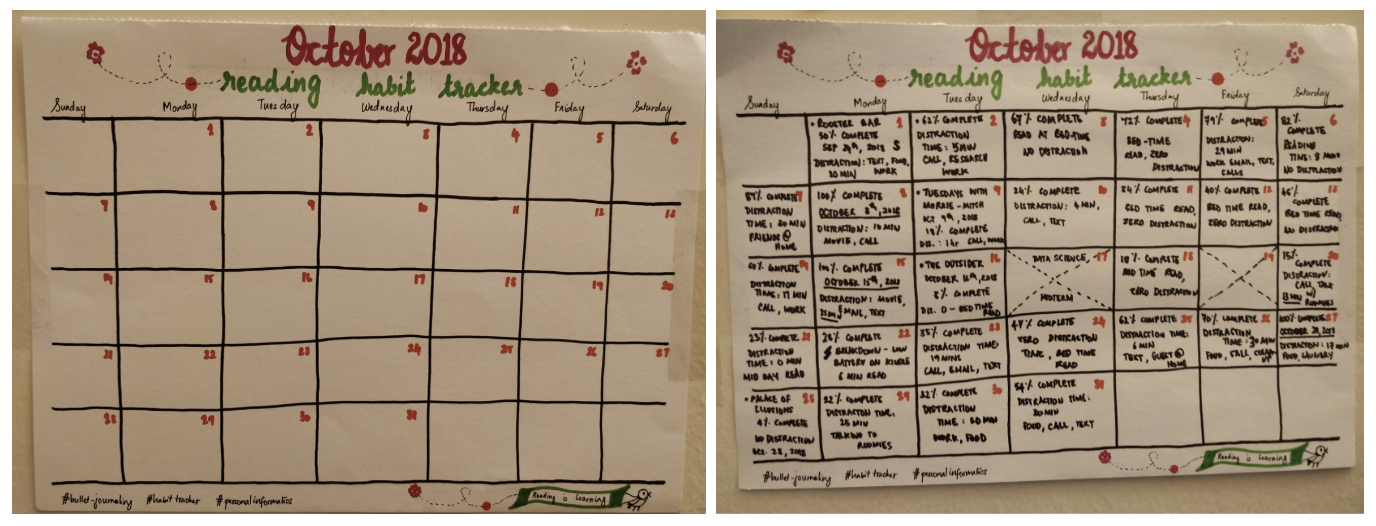
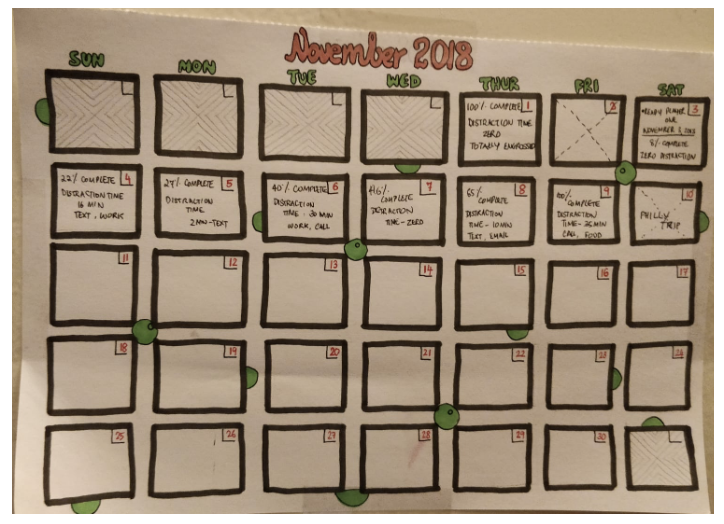
While doing a literature review of the apps I could use to track my variables, I found that there was no app available on the Play Store to record distraction times during reading. Being inspired by the concept of bullet journals, I maintained a calendar layout bullet journal to track the number of days that I read, period of distractions and reasons for my distraction, name of the book that I am reading, date of starting to read the book and date of finishing the book.
Apart from the manual tracking I did, I also used ReadTracker (an Android application) to track my reading times, session-wise progress and to jot down any quotes/questions that I had while reading through the book.
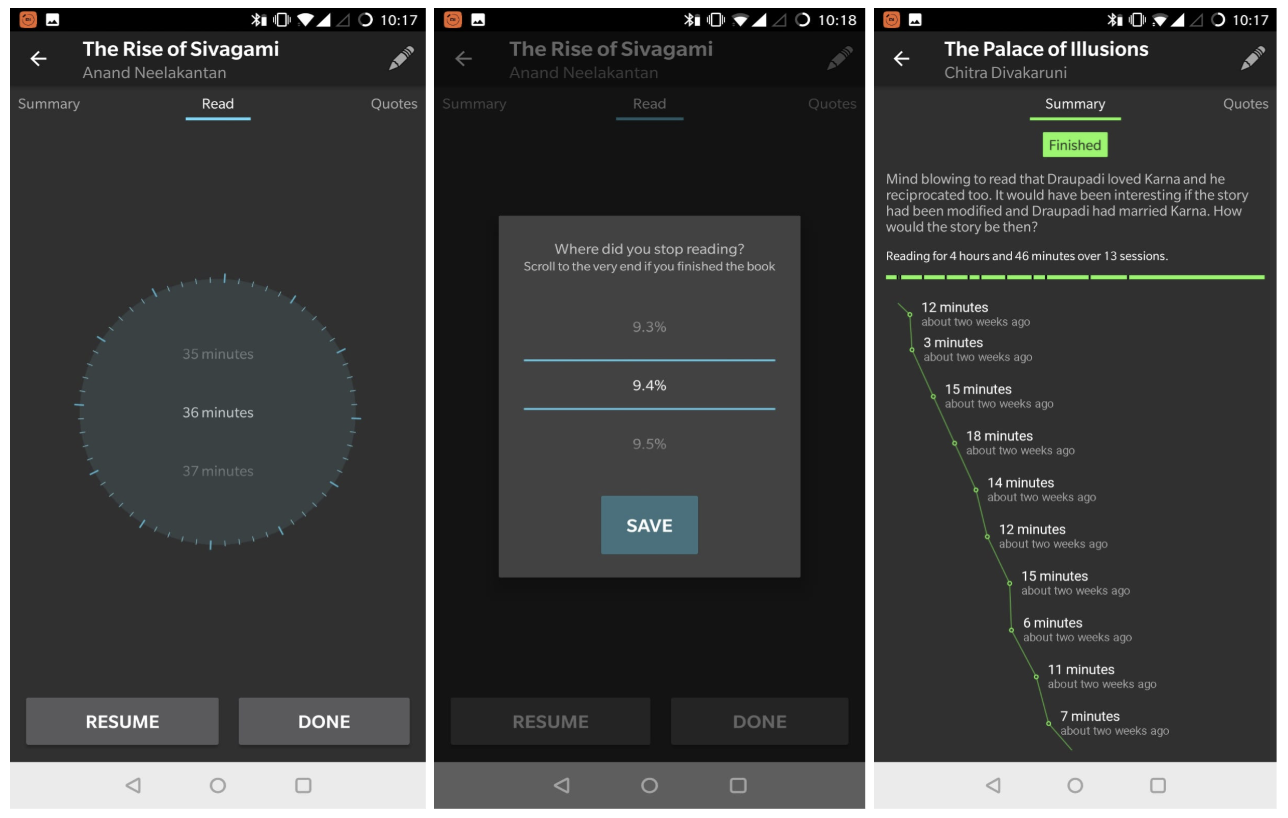
The app had a timer which can be paused and resumed while I am reading and when I finish reading and click on Done, a progress completion drop down comes up with which I can select the %completion for that particular session. Once I finish reading a book, I had the option to leave a summary of the book and the app also displayed stats of my reading, my reading times for each session and how many hours I read over how many sessions. The app also displayed a basic progress visualization based on our reading times and % completion from the start to finish of reading a book.
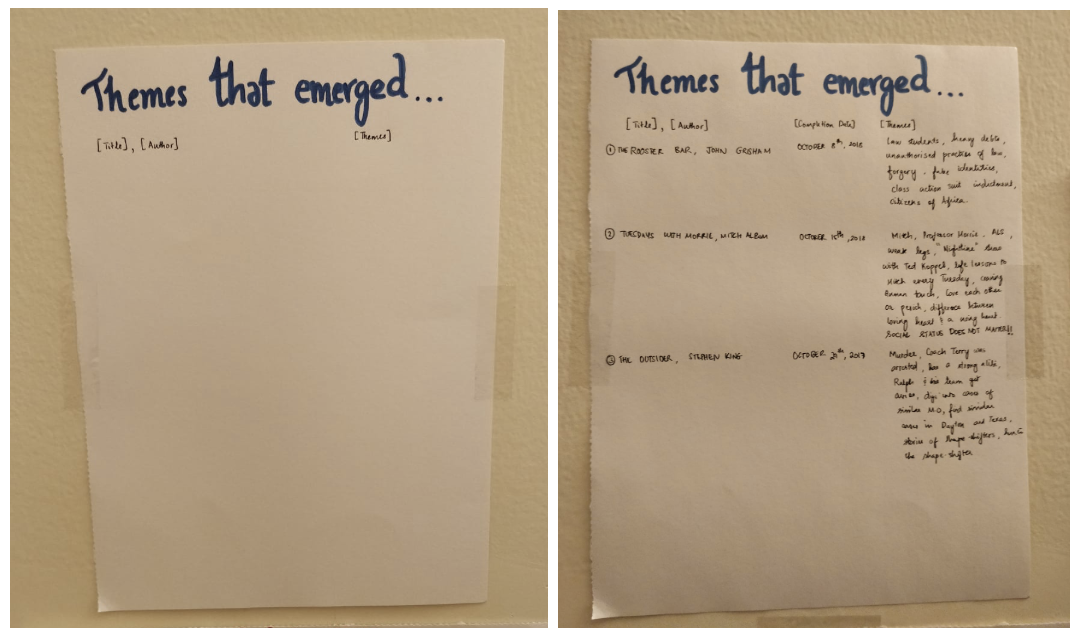
Apart from the manual bullet journal and ReadTracker, I also maintained a separate journal to jot down themes that emerged from the book after finishing it through to the end.
Data Tracking Period
The actual manual journal tracking started on October 1st, 2018 but I also roughly jotted down data of my reading stats from September 24th, 2018 through to November 9th, 2018 marking the completion of my 5th book read. Overall, I had about a month and 20 days worth of data with which I reflected upon to find behavioral patterns that I could use to strategize and minimize distraction. Moreover, through this data tracking period, since the manual journalling also brought in a continual reflection phase where I could look at my data every time I jotted down details or read through the data whenever I wanted, I was mindful and realized the time that works for me the best to focus. For this very reason of continual reflection and getting what I needed out of the data whenever I could, I did not revise my method of tracking nor did I add any additional variables to track over the course of my tracking period.
Final Dataset
When I exported the data from my ReadTracker app, I found it to be very complex to discern any information from it. The information that the app provided was also not very useful for me to reflect on the data and the column names also did not make any sense. Moreover, the app in itself was not very intuitive for me to track data. Luckily, I had tracked my distraction times in my calendar journal which helped me record my distraction times and reasons for my distraction for my final dataset. From the ReadTracker app, I was able to extract my reading times across several sessions in a day and also able to record the number of sessions I took to finish a book.
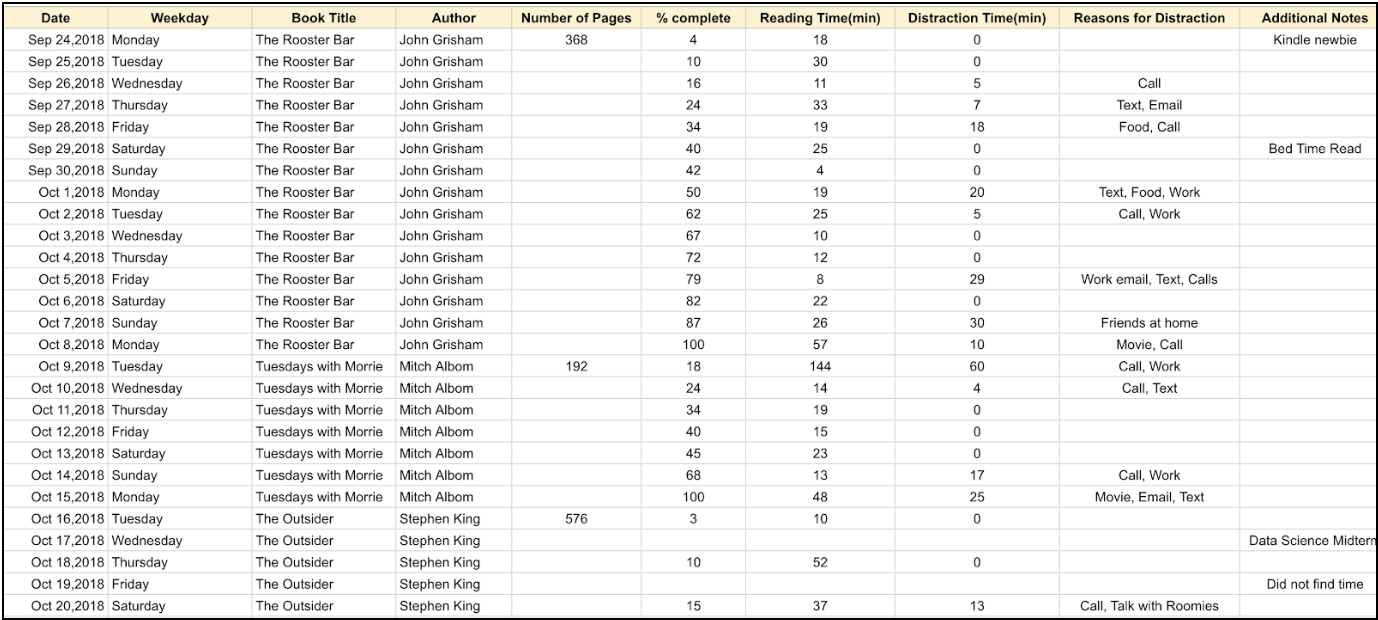
My final dataset comes from two spreadsheets. The first spreadsheet contained a day wise data consisting of the date, book being read and the author of the book, number of pages in the book, %completion for the day, reading time for the day, distraction time for the day, reasons for my distractions and additional notes.
The second spreadsheet is a high-level overview of the first spreadsheet and contains number of books read during the tracking period, name and author of the book, genre of the book, start and end dates of reading a book, number of pages in the book, total number of sessions(from the ReadTracker app), Total Reading Time(in minutes, from the first spreadsheet), Total Distraction Time(in minutes, from the first spreadsheet) and Reasons for Distraction(summation of distractions recorded in the first spreadsheet).

Over the course of my tracking period, I did not read using any hard copy books, I only used my Kindle so it was essential for me to capture my breakdowns due to Kindle. Throughout the whole period, I recorded 3 days of no reading and 1 day where my Kindle was low on battery. So to say, across a 47-day tracking regimen, I had breakdowns only for 4 days which is about 91.4% of tracking adherence.
Data examination and exploration
I started to explore the day-wise data how I could combine different columns in the spreadsheet to get meaningful insights from them. I recorded my data on Google Sheets but used Microsoft Excel to manipulate the dataset as I was comfortable using Excel to make different analysis. On exploring Charticulator, I noticed that unlike Tableau we will not be able to manipulate data and combine columns within Charticulator. For this very reason, I made another high-level overview spreadsheet that I fed with the manipulated data from the day-wise data. The overview spreadsheet contained total reading times for a book while the day-wise data contains reading time across sessions in a particular date for a book.
Observation and Data Analysis: Initial Visualizations
From the data that I had collected over my tracking period, I visualized the following aspects and reflected upon them -
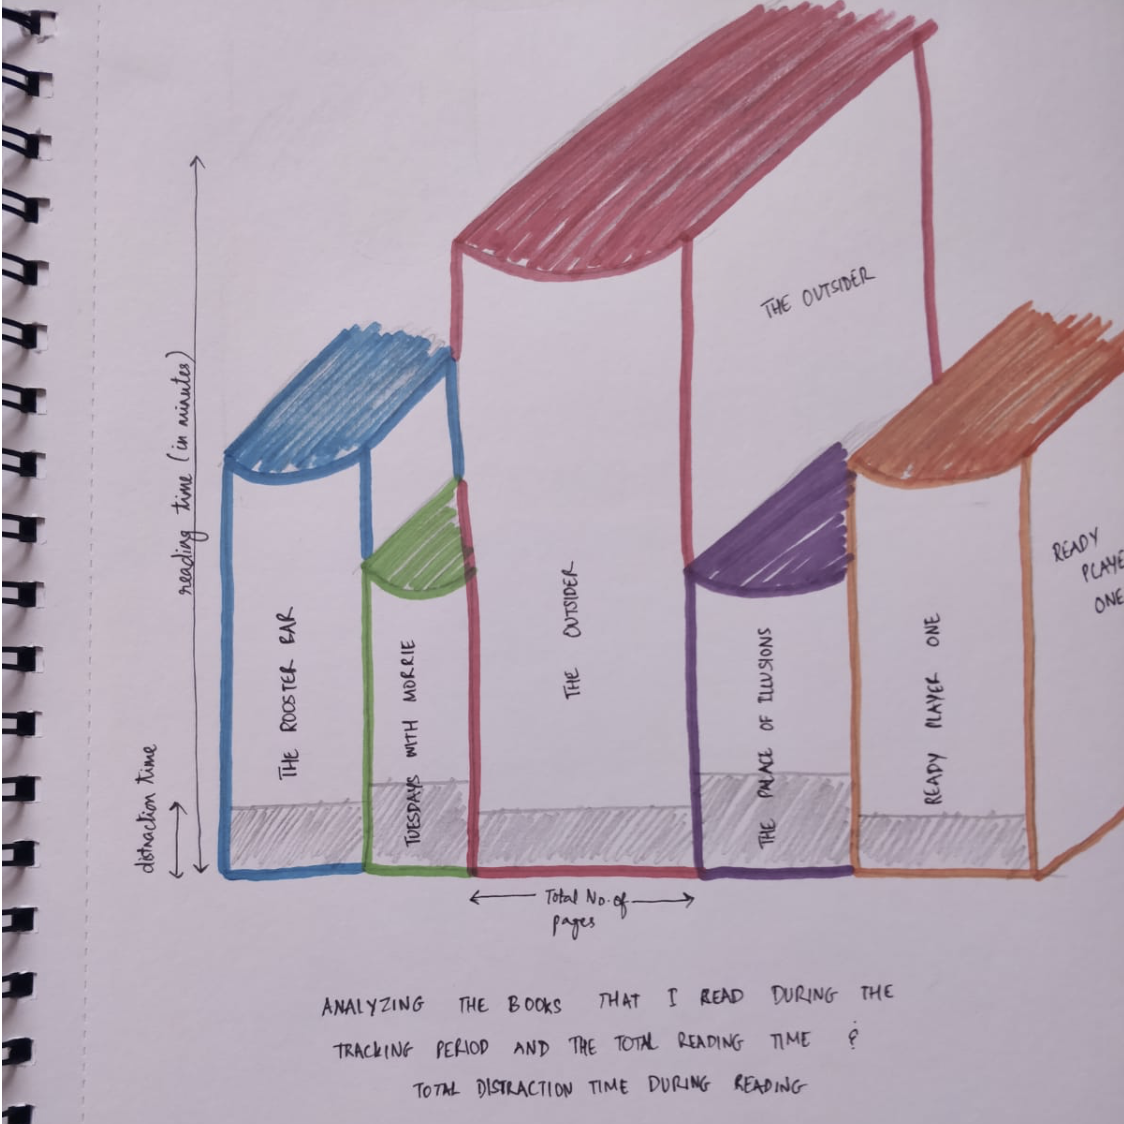
- My Bookshelf: The number of books I read(and the genre of the books) Vs. My Reading times and Distraction times while reading the books
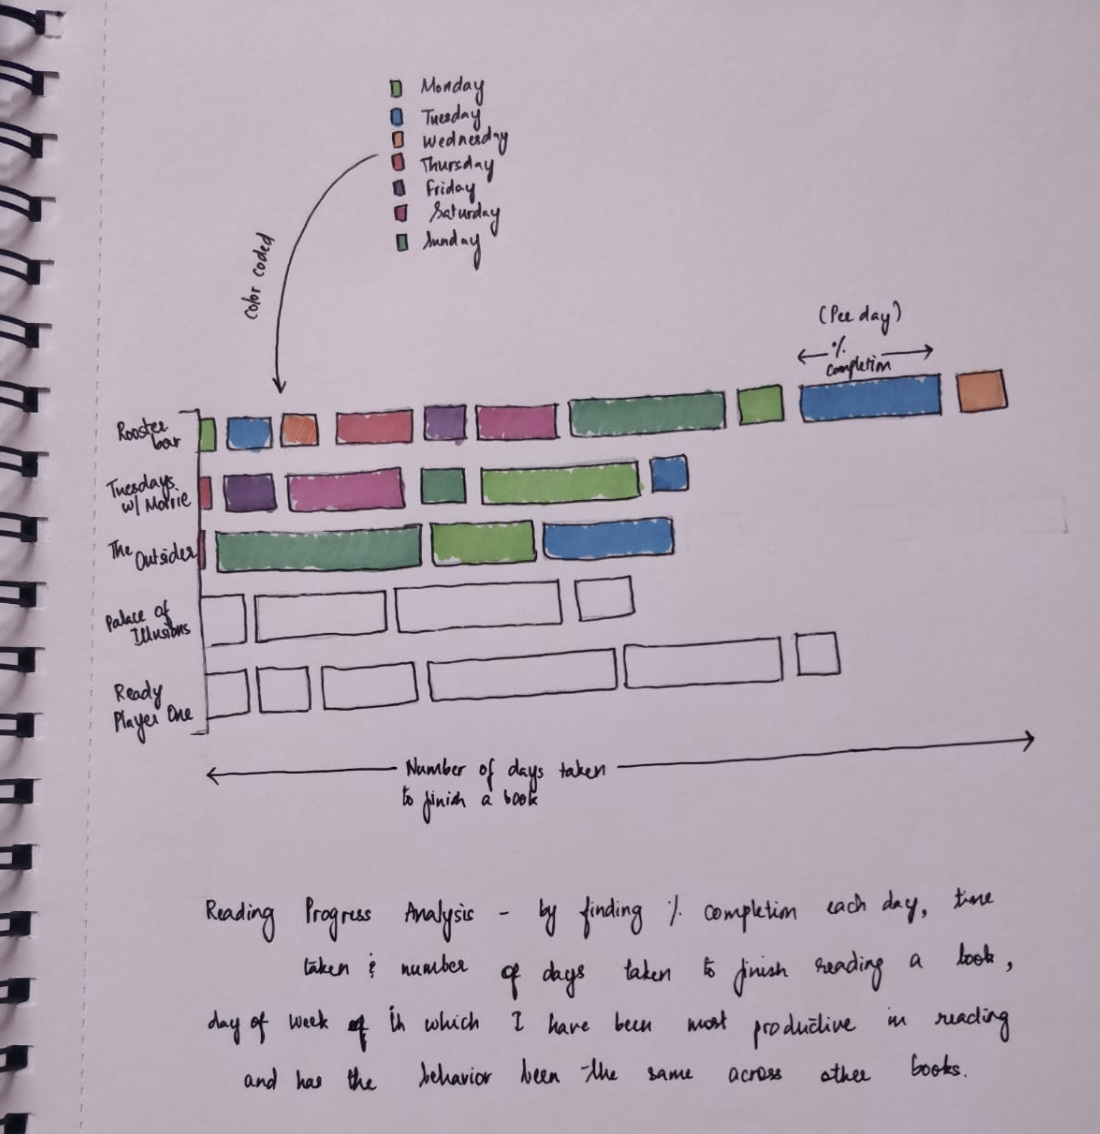
- Assessing productivity: The number of days it took me to complete a book and my %completion
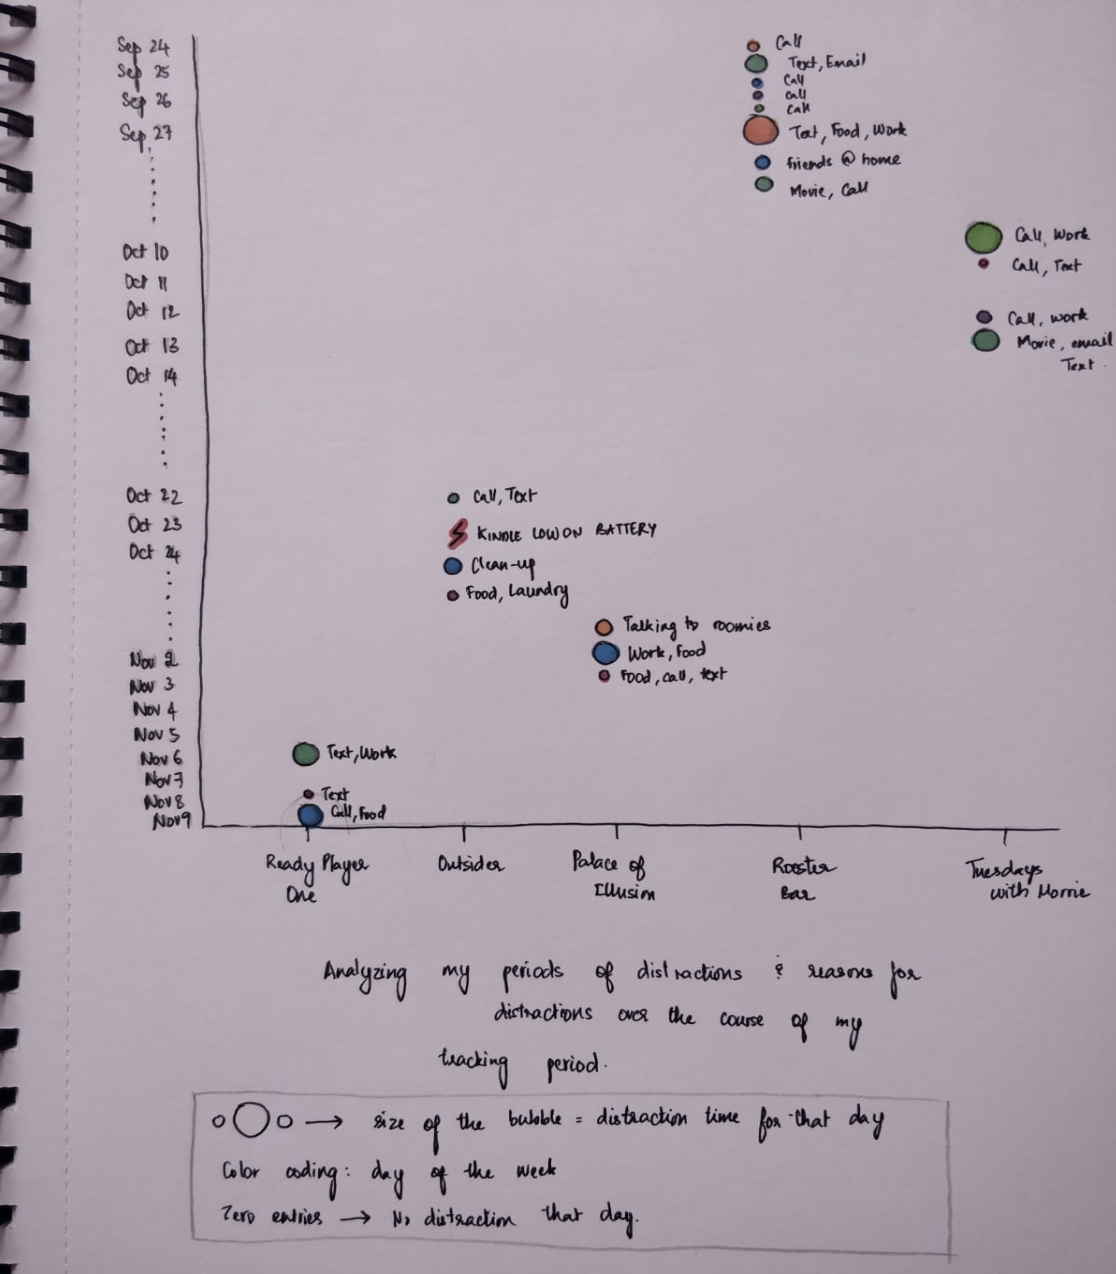
- Analyzing distractions: Days that I was distracted the most and the reason for my distraction
My Bookshelf
Through this visualization, I wanted to analyze the number of books that I read and the time it took me to read the book and my total distraction time while reading.The visualization symbolizes a bookshelf arranged with books that I read. The width of the book is the number of pages in the book and the height of the book being the total amount of time spent in reading and a portion of it denotes the total amount of distraction time while reading the book. I also wanted to know the different genres of books that I read even though the amount of data collected is not sufficient to analyze and predict the genres of books I am interested in.
Assessing Productivity
Through this visualization, I wanted to track the number of days it took me to complete a book and my % completion per day(similar to a reading progress per day). I also wanted to find out which days suit me the best and in which days I have been the most productive in reading. The visualization looks like a progress bar with the gaps indicating different days and the width of the bar indicates the % of the book completed in that particular day. The progress bar is categorized using the book titles.
Analyzing distractions
In this visualization, I have taken day-wise data to see when I was distracted the most and during which book and what are my reasons for distraction. I initially thought of using a Scatterplot like design in which the size of each bubble will be characterized by the distraction time for that day. Alongside each bubble in the scatterplot, there will also be the reason for my distraction. This graph is again color-coded based on the days of the week to understand on which day I have been distracted the most. I intended to use days of the week color-coding for this graph as well, so as to compare the insights from the previous visualization and this visualization(i.e., has there been more distractions on the days that I have read the most or is it the other way around?)
Final Visualizations
My Bookshelf
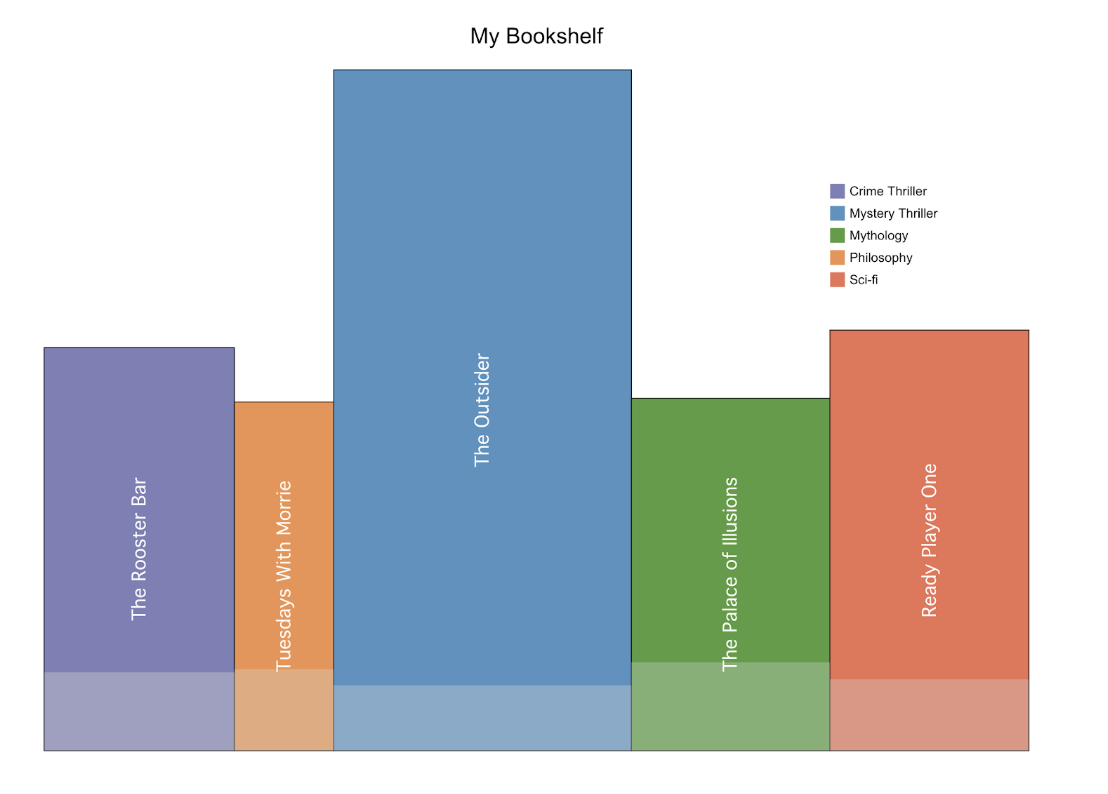
Through this visualization, I wanted to analyze the number of books that I read and the time it took me to read the book and my total distraction time while reading.The visualization symbolizes a bookshelf arranged with books that I read. The width of the book is the number of pages in the book and the height of the book being the total amount of time spent in reading and a portion of it denotes the total amount of distraction time while reading the book. I also wanted to know the different genres of books that I read even though the amount of data collected is not sufficient to analyze and predict the genres of books I am interested in.
Assessing Productivity
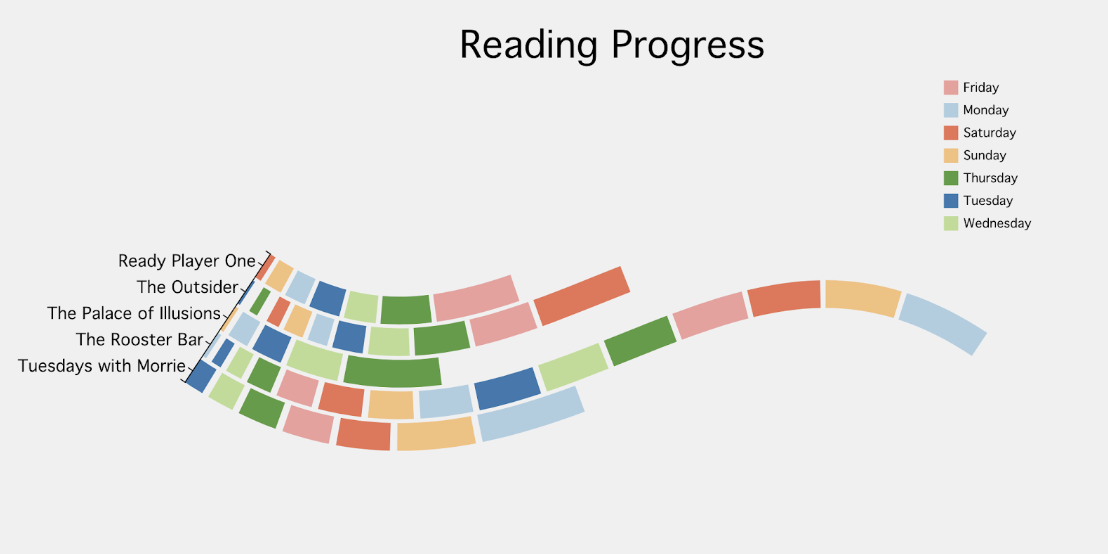
From this visualization, we can see that I finished the ‘Palace of Illusions’ book in 5 days which is the fastest and the slowest I have read is ‘The Rooster Bar’ for which I have taken 15 days. It is interesting to note that I have been most productive(have shown a lot of reading progress) particularly on Saturday(weekend) and Monday(weekday). It is surprising to me that I have shown a lot of progress on Monday even though it is a school night.
Analyzing distractions
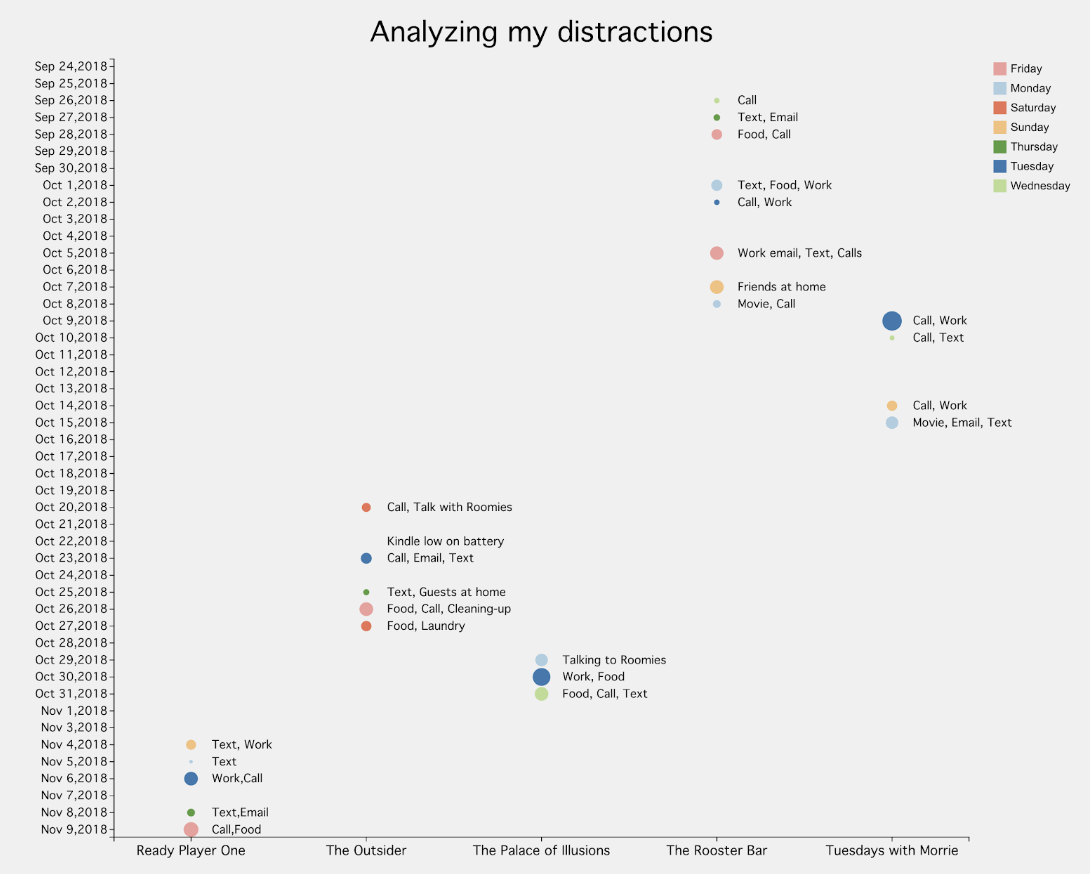
From this visualization, it is evident that Oct 9th, 2018 was the day in which I was maximum distracted and that was when I was reading the ‘Tuesdays with Morrie’ book. The reason for my distraction on that particular day was due to several calls and work. Apart from that, there has been a lot of days with zero distractions(bedtime reads) and 25 days(out of 47) with minimum to maximum distraction. To analyze patterns, it looks like I was maximum distracted on Tuesdays and Fridays(which is opposing to the insights I obtained from the previous visualization) and is surprising to note that the days I read minimally are the days when I was distracted the most.
Learnings
Through this self-tracking project, I was able to gather more insights and by applying a continual-reflection method, I understood days I was maximum distracted and more productive on. Self-tracking helped me to stay motivated and I was extremely surprised when I attained interesting insights through which I would be able to modify my strategies and become an avid reader once again reliving my childhood days. The project also helped me assess my reading style(the genre that I liked to read although minimal, but really useful), the times I was most productive at and things that deter me while I am reading. The next time I read, I would probably shut off all the distractions and just focus on the book in hand. I was also very surprised to see different behavior patterns between my distraction times and my reading times. Overall, I believe that I have had a very satisfying self-tracking experience and I look forward to tracking more in the future.
